Maps & Layers
Visualize your journey on the interactive 3D globe
Maps & Layers
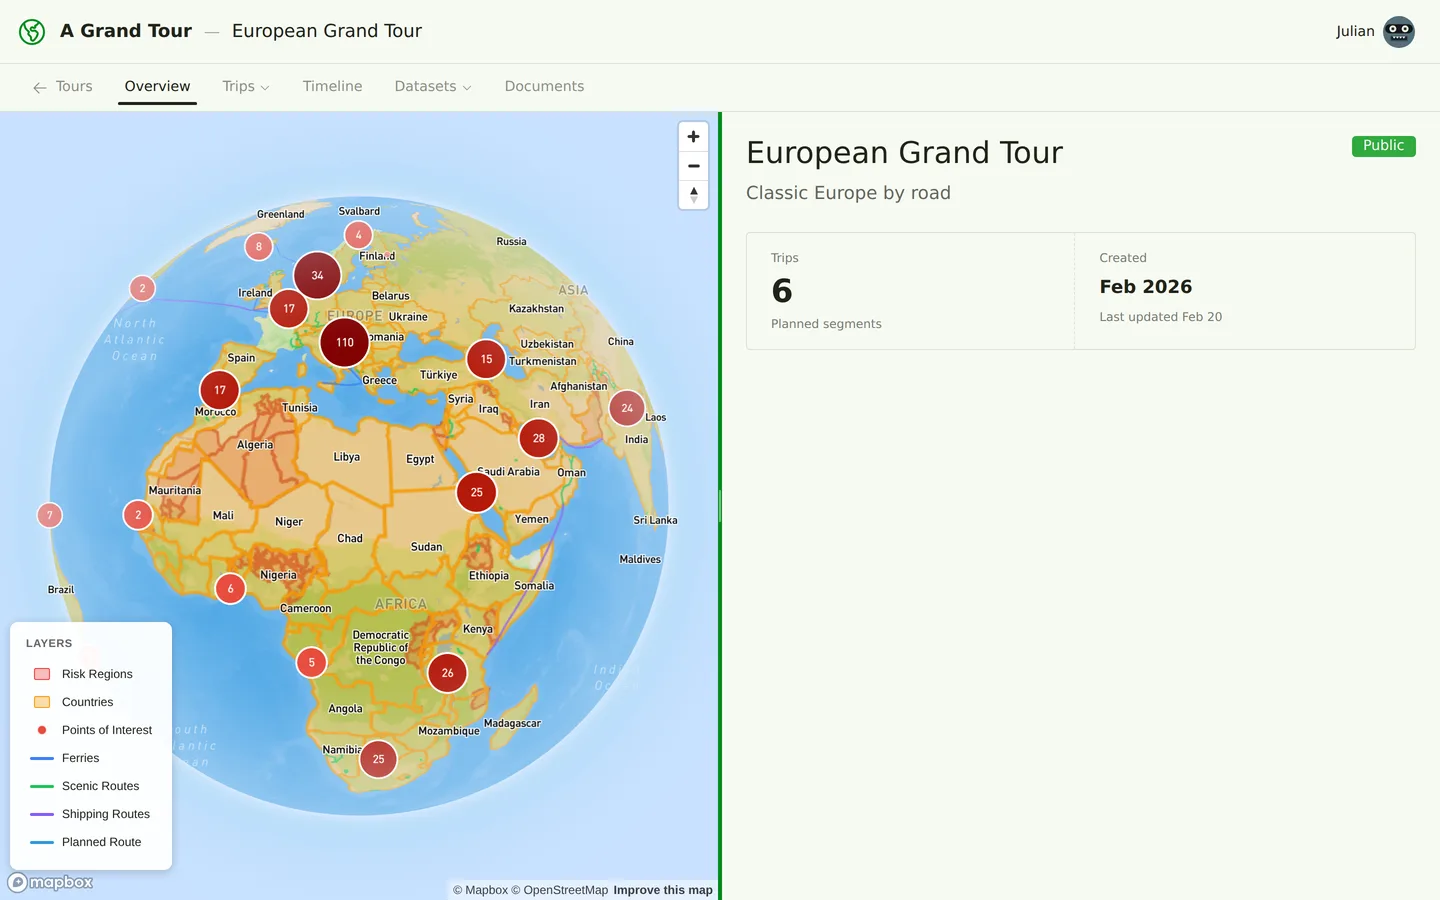
The map is the heart of A Grand Tour. Every aspect of your journey comes to life on our interactive 3D globe, giving you a comprehensive view of your expedition from planning to execution.
The Interactive Globe
A Grand Tour uses Mapbox GL JS to render a stunning 3D globe that you can explore with intuitive controls:
- Pan: Click and drag to move around the map
- Zoom: Scroll or pinch to zoom in and out
- Rotate: Hold Ctrl (or Cmd on Mac) and drag to rotate the globe
- Tilt: Hold Shift and drag to change the viewing angle
- Fly-to animations: Smooth transitions when navigating to specific locations
Map Styles
Choose from multiple base map styles to suit your preferences and needs:
- Satellite: High-resolution satellite imagery for realistic terrain visualization
- Streets: Detailed street maps with roads and place names
- Outdoors: Optimized for outdoor activities with topographic features
- Light/Dark: Minimalist styles that emphasize your route data
Map Layers
The true power of the map system lies in its layered data visualization. Toggle different layers on and off to focus on what matters most for your planning:
Trip Routes
Your planned routes appear as colored lines on the map, with each trip using a distinct color for easy identification. Routes are rendered with multiple segments representing different transportation types (driving, ferries, flights, etc.).
Points of Interest
POIs appear as icons categorized by type:
- Natural wonders (mountains, waterfalls, viewpoints)
- Historical sites (ruins, monuments, archaeological sites)
- Cultural attractions (museums, temples, festivals)
- Practical stops (border crossings, fuel stations, repair shops)
Click any POI to see detailed information including descriptions, ratings, and photos.
Scenic Routes
Highlighted paths showing renowned scenic drives and routes, complete with:
- Star ratings (1-5 stars) indicating how spectacular the route is
- Distance information
- Description of what makes the route special
- Photos from other travelers
Ferry Routes
Ferry connections between ports shown as dashed lines, including:
- Operator information
- Typical journey duration
- Seasonal availability notes
Risk Regions
Areas with travel advisories or security concerns are overlaid in red or orange, helping you make informed decisions about routing. Each region includes:
- Risk level classification (problematic or impossible to travel)
- Reason for the designation
- Last updated date
Country Borders and Labels
Clear country boundaries with names help you understand border crossings and visa requirements at a glance.
Layer Controls
Use the layer control panel to show or hide individual layers. This is especially useful when you want to reduce visual clutter and focus on specific aspects of your plan.
The layer system is intelligent: when you click on a feature (like a POI or scenic route), the map automatically highlights that item and may temporarily adjust layer visibility to bring it into focus.
Interactive Features
Clicking on map features opens detail panels or popups:
- POIs: See full descriptions, images, user ratings, and links to add them to your itinerary
- Routes: View segment details, distances, and estimated travel times
- Countries: Access country information including visa requirements, safety ratings, and driving regulations
- Scenic routes: Explore photos, descriptions, and add waypoints to your route
Map Legend
The legend (accessible from the map controls) explains all symbols, colors, and patterns used on the map, ensuring you can interpret every element of the visualization.
Tips for Effective Map Use
- Start zoomed out to see the big picture of your journey, then zoom in to plan specific sections
- Toggle off layers you don’t need to reduce visual complexity
- Use the satellite view when planning routes through remote areas to assess terrain
- The 3D tilt feature is especially helpful for understanding mountainous regions
- Combine the scenic routes layer with your planned route to identify highlights you might have missed
Related articles:
- Routes & Waypoints - Learn how to plan your routes
- Points of Interest - Discover and add POIs to your journey
- Itineraries - Build day-by-day plans with the places you find on the map